I have a template as part of my governance workbook download, but it’s not hard to get started on your own: create a spreadsheet with one row per tag/vendor account, with columns for at least the following:
Vendor (Facebook, Doubleclick, etc)
Account Number- your key to the audit*
Date of last update to tag
Internal Owner/Agency Contact Info
Next Steps (investigate, keep, remove)
*That account number can become a useful tool for finding more information about the tag. If I look in my email box for the word “Adwords”, the results would be hard to wade through. But If I search for my Adwords account number, “AW-123456”, it will take me directly to correspondence about that tag. This also helps when using your TMS’s internal search functionality, or to use as a filter in the network tab:
It’s ok if this sheet is a work in progress- in fact, I guarantee it almost always will be. It’s ok if the sheet only has information in three rows, or just has the first two columns filled out. It is better to have a blank workbook so you can at least have a place to store info as it becomes available, or to add new tags to, than to have nothing at all. Just fill in what you can, when you can.
Use Tools Like Observepoint
Observepoint has a free chrome extension that you can run to see which known marTech tags are on any page you access:
It will automatically map domains to known vendors and show you account numbers where applicable (again, you can see how those account numbers are handy for tying information together). Since this tool works on a page-by-page basis, I recommend running it on your home page and any key conversion points, like a purchase confirmation page, because most of your tags are likely to be represented there.
If you want a more comprehensive scan of your site, the paid Observepoint App does just that- it crawls your site and gives you a full report of everything it finds. You may need to teach it how to get to parts of the site that require interactions (like logging in, or entering credit card information) but with Observepoint, the more time you can invest in it up front, the more value you will get out of the tool.
The nice thing about the paid app is it has an under-appreciated “Tag Initiators” tool that shows you which tags are loading other tags, which is invaluable for helping figure out where your less-obvious tags are coming from.
A quick note: Observepoint may not recognize and catch some of the more obscure tags- I did come across a few that the extension didn’t pick up (though I have no doubts they have a drastically more comprehensive list than I do). I don’t think this is a shortcoming of theirs, but just the nature of the beast: there are almost 10,000 marTech vendors now, and many of them use multiple domains for tracking. But just in case, you may still want to run the webpagetest.org domains report and analysis I talked about in my post on marTech impact, and may need to supplement their mapping with information from our vendor/domain mapping database, or you may have to do some research on your own. I’ve found better.fyi to be a great resource for this type of research.
Use TMS Container Export tools
There are free tools for both Adobe Launch and GTM to help you see all your different tags (and help you get a sense of the health of your TMS set up).
For Adobe Launch, Tagtician by Jim Gordon is still one of the handiest things out there. It’s a chrome extension you can use to download an entire Launch library- toggle the library option at the top:
Then click “export”:This will give you a spreadsheet with information on every rule, data element, and extension in your Launch environment:I tend to move the “extensions” and “data elements” info to their own tabs, then add some columns to the rules data:
Tag Vendor
Vendor ID
Event
Potential Last Date Updated (or Date Implemented)
Notes
I turn it into a table and organize by Extension, add columns for Vendor, Account Id, event (What the tag does), date of last update, notes, etc… and then just start at the top and work my way down:
Sometimes, the tag is directly in the exported file in “action detail”, but much of the time custom code resides in external JS files and frankly, I haven’t found an easier way to get at the code than to just open Launch and go looking for it.
Urs Boller also has a great tool for Launch: the Launch Parser. It makes it easy to see the relationships between the different components (what data element is getting used where, etc) and also helps spot problems and make recommendations.
For GTM, Simo Ahava has a great tool for showing all the different components (tags, triggers, variables, containers) and their relationships to each other. Then if you want to dive deeper, you can export your container directly from the GTM Admin console:
This spits out a JSON file that can be a bit intimidating, but you can paste it into a tool like json2table.com to turn it into a much more manageable spreadsheet.
Do what you can
I know an audit sounds like a lot of work. At the bare minimum, set up that Tag Inventory and just start documenting things going forward, then audit past stuff when you can. I recommend just taking on one vendor at a time (eg, all your Facebook tags at once). Apply a new naming convention/meta data standard as you go to keep track of what you’ve updated/inventoried and what you haven’t.
It’s better to have something in place, even if it’s imperfect.
Regardless of how much effort you can put into cleaning up current tags on your site, there are relatively simple things you can do, starting now, that will improve the future health of your marTech implementation.
Keep information ABOUT the tag WITHIN the tag
Within each tag, include info about the tag:
Who requested the tag (include any contact info for the agency, vendor support, internal sponsor)
The date the tag was deployed or updated or confirmed to be in use (and if known, date to remove)
Who deployed the tag
I like to do this directly in the JavaScript, but you can also include at least some of that info in the Rule, Tag or Action name, or you can use the TMS “Notes” functionality (both GTM and Adobe Launch have it)- just be aware that not everyone is good at looking at notes (they can be a bit sneaky) and they don’t show up in a lot of auditing tools and such.
However you do it, keeping this information directly with the tag makes it so easy for everyone to have context around the tag and makes it easy to keep your TMS set up healthy and current.
Use a Tag Request Intake Process
We’ve helped a lot of our clients implement a formal MarTech Tracking Request Intake process. When someone comes to you asking for a new tag to be deployed, you can have them fill out key information such as contact info, go-live date, tag vendor/account ID… This information can help in a few ways:
It cuts down on the back-and-forth between the implementor and the tag requester (I’ve had some email threads go 20 replies deep, trying to make sure we were all on the same page about the tag. You’d be amazed how often I get Facebook tags without an account ID, for example.)
It gives you a chance to set expectations with the tag requester, like the fact you need 2 weeks of turnaround time, or that you’ll follow up with them on a certain date to see if the tag is still in use or needs updates.
It builds an audit trail and can feed directly into documentation, like for the Tag Inventory you should be keeping.
I have an example in my my governance workbook download, but it doesn’t have to be a spreadsheet. It can be a google form, a JIRA template, or just a something you paste into an email.
Keep a “pixel menu”
I’ve found it can be a huge help to have a standard list of what user actions you usually have tags on, and what dimensions are available at those times.
At bare minimum, this can be a great internal resource for the implementors and, say, a Center of Excellence. Sometimes it can be helpful to show vendors/agencies to get on the same page about what’s worth tracking…. just be warned, sometimes if an agency sees such a list, they’ll just say they want all of it. Which brings me to my next suggestion:
Consider having some restrictions on what you deploy
It’s ok to push back on Tag Requests. Consider:
Do you only deploy certain types of tags? Maybe things that you already have a set up for, or that have passed a security review.
Do you only deploy on certain user actions (do they have to “stick to your list” in the pixel menu)? If they ask for a tag on both the click of the search button and the load of the search results page, ask them WHY. Sometimes they’ll have a reason, but much of the time they’ll say that the button click was just a nice-to-have, and they’ll tell you what items are actually a priority. Pro tip: mention to them “our turnaround time can be pretty quick if we stick to these particular user actions, but if you need something custom, that might slow things down. Maybe we can move forward with the priority tags for now, and circle back to your more custom requirements later?”
Do you ask them to justify the business value of the added weight and complexity that their tag brings? Some of the most complicated tags I’ve deployed turned out to be for something not providing a lot of value. Much of the time, the data a tag is supposed to be delivering can already be found other ways (like with an analytics tool).
Establish a follow-up cadence
Set up a calendar for your TMS. Each time you publish a tag, add a reminder one year out to followup:
It takes very little effort or commitment in the here-and-now, and makes it easy to followup without it being part of a massive clean up effort.
Just… do something
Don’t wait until you can get it perfect. Do what you can, when you can. Make a commitment for the little things you can do going forward that your future self will thank you for.
As a brief primer for those still learning about Server-Side Tag Management: currently, most of us deploy a “client-side” tag manager (which means it runs within the user’s browser). The client-side TMS uses JavaScript to gather information from the page about the user’s journey, then send that information along to third parties in the form of pixels, iframes, and scripts.
A server-side TMS still has that client-side component- it still needs to gather information in the user’s browser. But instead of sending that information to third parties using scripts, pixels and iframes, it sends all the info in one big batch to a server, where you can then divvy it up and send to third parties using APIs.
This is a wonderful technology that will be used more and more in the future. Tealium has long had a server-side option, and now Google has GTM Server-Side and Adobe has Event Forwarding. But server-side tag management does have some limitations:
This technology is fairly new. It can be hard to find documentation and expertise. And frankly, some of the tools still feel a little “beta”.
Not all tags have a server-side option. Facebook is pushing it really hard with their Conversions API, but Bing doesn’t even have a way to send data through APIs yet. In my example image above, you can see that Bing has had to stay client-side while other tags moved out. Some tags will always need a client-side component: anything that changes the user experience needs access TO that experience as it loads. So scripts for optimization, personalization, recommendations, voice of customer… they may always need to have some part of it maintained on the client-side. Maintaining a server-side container and a client-side container does complicate things, but for now it’s the only way forward for most folks.
The client-side component of server-side tracking still needs a way to identify the user as they move from page to page, and for the foreseeable future this will be done using cookies. GTM Server-Side can actually help a little with this, as you can use it to deploy HTTPS cookies that will make browsers like Safari happier. It can do this because you run the container on your own server, which does have a cost, but it also allows you to do first-party things. Adobe (and Tealium, as far as I can gather) host the server-side container themselves, which is less complicated for you to set up, but makes it so they can’t really help with the whole make-happier-cookies thing (though they certainly don’t hurt either).
Server-side tag management still requires governance. Just because it doesn’t cause JS errors and doesn’t slow down your site doesn’t mean it doesn’t matter who you share your user’s data with. Server-side tracking is still subject to privacy regulations. GDPR and CCPA don’t care if you use JavaScript or APIs to share your user’s data, it just cares that you are sharing that data.
I’m not saying folks shouldn’t move part of their implementation server-side- I’m actually very excited to see this technology roll out more. We just need to approach it realistically and be as well-informed as possible before making decisions about it.
This is a question I get asked a lot: should I use my Tag Management System’s Extensions (or Plugins, or Tag Templates, depending on which TMS), or should I just copy-and-paste tags as custom code? The true consultant answer is: it depends.
Extensions do have some inherent weight. In GTM, adding a single AdWords conversion event using the Tag Template can add 10-20KB to the weight of my container. Extensions can be heavier than a simple code deployment, but lighter than a messy code deployment.
Extensions are less flexible. If you have conditions around your tags, such as “in the US, add these variables to our Doubleclick conversion event, but in the UK, leave those out”, that can be really hard to implement using an extension, but fairly simple in code.
Extensions are less likely to cause JS errors. They get load order correct (eg, Launch’s Target extension ensures the Target script has loaded before it add params, which it does before it fires an mbox). They’re more likely to stay updated, which means they’ll work best in current browsers and be more compliant with regulations.
The main thing I want folks to think about is what they’d be willing to give up in order to avoid code. A lot of companies set forth with the goal of having a code-free implementation, thinking that that is the best practice worth achieving. But in many cases, that goal isn’t worth the cost. Vendors/agencies often send their tag requests AS CODE, intended to be copied-and-pasted:
So someone is going to have to interpret that code into the friendly UI of the extension, which does introduce room for error… perhaps more error than merely copying-and-pasting.
I know code can be scary if you don’t have a lot of technical resources working on your implementation. Do what you think you can sustain. But don’t assume that code-free is the ideal you must fight to achieve.
Many tag vendors will tell you in their documentation that a tag must be placed as high as possible. This ensures that that vendor gets credit for every possible conversion, gets every possible data point.
It’s great for their data accuracy, and they may not really care if it has an impact on your page speed. But we do.
You have to find your balance:
Do you put the tag as high as possible, knowing it may negatively affect user experience by slowing down the page load?
Do you put the tag as low as possible, knowing that if users leave the page quickly, you may never get data about their experience?
Some tags actually DO need to be placed higher. Things that alter the user experience, like Optimization tools, need to have access to the HTML as it is loading. But conversion tags? Are they really worth a potentially slower user experience? It may not matter for one tag here or there, but it adds up!
I don’t think I’ve ever had someone ask me to move the tag up, no matter what the documentation always says. You are the ultimate decision-maker about what tags get deployed, where.
UPDATE, April 2023: To my dismay, I’ve learned that my understanding of GTAG was wrong, therefore much of this post is wrong. I still stand by the statement that you should try to remove duplicate code and libraries where possible, but in the case of GTAG… for every “config” you pass, Google will load a new GTAG library for you, adding weight to your site. So, thanks for that, Google.
This is a “low hanging fruit” best practice, but one that most companies could gain from: consolidate tags from the same vendor. Especially if they load an external JavaScript file. For instance, if I’m deploying both an Adwords GTAG and a Doubleclick GTAG, I might paste them both as custom code:
This means that “https://www.googletagmanager.com/gtag/js” file loads twice. It’s a 40 KB file, with no benefit for loading multiple times.
This code accomplishes the same thing, minus 40 KB of dead weight:
You can take it a step further and consolidate events, too- I don’t need to fire a conversion event twice, I can just add multiple destinations to my send_to variable:
This tip isn’t specific to gtag, though that is one of the tags that I see duplicated the most. Anytime you are deploying two tags from the same vendor on a page, odds are there is some part of that code that doesn’t need to be repeated.
How you name your rules, events/triggers, tags and actions can have a big impact on the health of your TMS. You want to prevent duplicated conditions and logic as much as possible, to keep things simple, lighter, and less error-prone. You want to make things easier to find and easier to put into context.
Launch Rules, Events, Conditions, Data Elements, and ACTIONS
Let’s face it, the internal search functionality in Launch isn’t great. But there is much you can do to make navigation within Launch easier and cut down on duplicated logic.
For rule names, I often follow a format with some combination of the following:
category[: sub category] | trigger | [type (analytics or marketing)] | what the rule does/marketing vendor | load order | consent management category
For example:
add to basket | “add to basket” event | analytics | s.tl | #50 | C0008
search: search results | “page view” event | analytics | set vars | #50 | C0008
Of course, it usually differs for every client depending on their needs. For me, the important thing is for rules with similar events/conditions to be together (all my search rules start with “search:”), to know what triggers it (page bottom? direct call rule?), and to have an idea of what’s inside. Here’s a simpler version:
Having it arranged this way already shows me for this property…. I have a lot of rules firing on that page view event. I could probably consolidate some of those into a single rule. I also see some inconsistency… one “page view” is lacking quotes, which makes the editor in me twitch a bit, and in that top one I didn’t specify s.t or s.tl beacon. But you know what? I can navigate this property pretty easily. And if I see an inconsistency, I can fix it as I go along. Some order is better than none.
Sometimes I only include the event order (eg, #50) if it’s something other than the default of 50. Sometimes we have analytics and marketing in the same rules so the standard has to adapt.
For events, I only change the name from the default if I had to customize it- page bottom is always just “Core – Page Bottom” (unless I changed the order, in which case I’d probably name it “Core – Page Bottom #1” or somesuch), but a direct call rule or something based on a CSS selector should always include that info in the name. For instance “click on .pdf links”, “DCR page view #25” or “payment modal enters viewport”. I won’t even be picky about following a standard… just keep it informative. If you changed the order (from #50 to, say, #1), then do note that. It makes troubleshooting so much easier.
Conditions should always have custom names. “Core – Value Comparison” is just not helpful… but “pageType of ‘search results'” is. Again, I’m not picky about following a standard… just make it so I don’t have to click into the condition to have an idea of what it is.
Action naming… this is where I get excited. Folks don’t take advantage of Action names nearly enough. Action names should include the marketing tag name and the scope. Within a rule, it might look redundant with the rule name (how many times do you see “All pages/Page Top” here) :
But if you search for a tag in the Launch’s search tool, those action names make a world of difference. Let’s say I’m searching for eVar63… this:
…is not helpful (by the way, please go upvote this feature request for better search functionality). I’d have to click in to each of those to find out what the context is to know which one I want to make my change to. But if I’ve added a bit of information to the action name, I can know exactly where it is taking me:
It’s a minor inconvenience when setting rules up, but if you have a complex implementation, it can make life so much easier.
For data elements, I tend to go much simpler. Some sort of categorization, then some sort of detail. If it suits the implementation, I might add more information about the source of the data. For example:
search: term | QP
search: number of results | DL
marketing: cmpid
content id: page name
I tend to always keep it lower case, since you have to have to right case when referencing a data element.
Don’t stop with good names, add even more info!
As I mentioned in my post on governance, it can be extremely helpful to include information about the tag within the tag itself, along these lines:
I’m presenting as part of a Rockstar Tips & Tricks session at Adobe’s Virtual Summit this year- if you’re registered, you’ll eventually able to view the recordings on-demand. But in case folks miss it or want more detail, this post walks though the tips/tricks I’m presenting. With the old Reports & Analytics (R&A) reports going away, I want to look at some of the cool fallout and pathing things we can still do in workspace.
Note, I do think this will all make more sense in a video demo than in a blog post, but I know the presentation went pretty fast, so this post can be a sort of supplemental guide for the video demo.
TL;DR
If you’re coming from my presentation and just want that way under-used TEXTJOIN excel formula from the end of Tip #2, here you go:
=TEXTJOIN(">",TRUE,A13:E13)
Also, in case I didn’t make it clear in my presentation (I didn’t), I recommend this Pivot Table filter to get to Full Paths: descending, by “Sum of Path views”, filtering on “Complete Path contains Exits”.
If that makes no sense to you, or you just want the full context, read on:
Tip #1: Fallout and Funnels
In the old R&A days, I had a few ways to track a conversion flow fallout:
The Custom Events Funnel gave a nice little graphical interface to compare numbers in. You could drag in events (no dimensions) to see them in a funnel.
A few things to note, though: first, the graphic did not change based on the data, so it could be misleading. Second, it didn’t actually pay attention to if the user did the events in sequence (notice in my screenshot that I have zero checkouts because I forgot to set it, yet 60 orders). Really, it was just a way to compare difference between events, regardless of sequence.
There was also a fallout report in R&A, which could be built off of pageName or any prop that you had the foresight to have pathing enabled on. (At least its graphic matches the data.)
Both of these are replaced in Workspace by the Flow visualization, which can be used for events (like an old Events Funnel):
Or on page names (or any other dimension- not restricted to pathing props):
This is already showing more flexibility and power than the old R&A pathing reports. But you could also mix and match events and dimensions. Let’s say I have a new campaign with 4 marketing landing pages and I want to see how those 4 pages collectively affect my Fallout. Because I’m setting page type in an eVar (which I consider essential to any implementation), I can bring in the page type to represent all four of those pages together, then continue the funnel based on page name:
I could pull events, props, and eVars all into the same report and see them in sequence and the fallout between. But I can take that a step farther and drop dimensions and segments into the area below the visualization key , where it that currently says “all visitors”, to compare how the fallout looks for just that dimension or segment. For instance, if I now want to compare those four pages, I can:
(Note, the top step has 100% for each dimension value because of course 100% of the visits with that page type have that page type.)
This visualization helps me spot something pretty immediately: the marketing page represented by the purple (sorry the names get cut off in the screenshot so you can’t see my Harry Potter references) got by far the most visits (75), but had the worst fallout. Whereas the one in pink had far viewer visits but much better retention. I’d probably go to the marketing or content team and see if we could get the best of both worlds somehow: whatever we’re doing to GET people to the purple marketing page, plus whatever content is on the pink one that seems to be getting people to STAY.
That’s just one made-up example, but there are so many ways this could be used. Let me know if you’ve found other fun ways.
Tip #2: Full Path Report and the Flow Visualization
One thing that Reports and Analytics for which Workspace doesn’t have a direct equivalent are the Full Path and Pathfinder reports. The Full Path report would show, well, the most popular full paths that users took through the site, from entry to exit:
Personally, I didn’t see a ton of value in this report because it would be so granular… if one visitor went page a>b>c>d, and another did just b>c>d, and another just a>b>c, they’d all appear as different line items in the report. However, I do know some folks like to include this in dashboards and such. But in my mind, most of the insight/analysis would be done in a Path Finder report. This helpful little tool would let you specify certain flows and patterns you were interested in, leaving room for filling in the blanks. The Bookends Pattern was a particular favorite: what happened between point A and point B? This would help analysts see unexpected user paths.
This is the functionality that currently workspace can’t directly replace. The closest we get is a flow visualization…. which may very well be my favorite Workspace tool. I should write another post about all the lesser-known great things about this report (segments! trends! pretty-and-useful colors!), but for now I’m going to focus on turning it into a full path report.
First, I bring Page in as an entry dimension. At this point, it should just be showing me my top entry pages. Since I want a more complete story, I’m going to click the “+_ more” so it includes more pages, then I’m going to right-click on that column and tell it to “Expand Entire Column”:
That’ll add a second column. I’ll keep repeating this process until I have 5 or 6 columns as expanded as can be.
Unfortunately, you probably don’t want to expand columns too deep or too far to the right because after a while Workspace starts slowing down and struggling. So this won’t cover all paths but it will help us get the most common ones.
With all of the winding and webbing between pages, it’s still hard to get at that list of paths…. for that, I need to take the report to Excel. So I send the report to myself as a CSV (either through Project>Download CSV, or Share>Send File Now). This gives me something like this:
It’s not quite useful yet. And something kinda odd happens, where it shows me all possible combinations of paths, even ones that never happened (all the lines that don’t have a number in the “Path views” column.) But that’s ok, we can ignore those for now. What I am going to do is create a new column to the right, and put this formula in it:
=TEXTJOIN(">",TRUE,A13:E13)
(Where A13:E13 are the cells of that row that contain all of my steps).
Then I copy that formula all the way down. This gives me a single string with complete paths, like “Entry (Page)>home>internal search>product details:skiving snackboxes>checkout:view cart>Exits”. I’ll also throw a name at the top of that column like “Complete Paths”.
This still isn’t really great for analysis, so I take it one step farther, and create a pivot table by selecting all the cells in my “Path Views” and “Complete Paths” columns (except for the empty ones up top), then going to the “Insert” tab in excel and clicking “Pivot Table”:
This will create a new sheet with an empty pivot table. I’ll set up my Pivot Table Fields with “Complete Paths” as my rows and “Sum of Path Views” as my values:
Then I’ll sort it, descending, by “Sum of Path views”, filtering on “Complete Path contains Exits” (otherwise you get incomplete portions of journeys, as the download will show the path “entry>a>b>c>exit” as “entry>a”, “entry>a>b”, “entry>a>b>c”, and “entry>a>b>c>exit”).
And there we go! A very rough approximation of Full Paths.
But there are a some nuances and caveats here, the main one being that it only goes so deep. The Flow Visualization really starts struggling when you have too many fully expanded columns, and the downloaded CSV reflects only the number of columns you had in the visualization. So paths that are longer than than the 4-6 columns are going to be excluded. Accordingly, this is ideally used for most common paths (which usually aren’t more than 5 or 6 pages anyway).
So this shows Full Paths, but where does that Path Finder stuff come in? Really, I’d expect this to serve as a starting point for a lot of further analysis in excel, where you can use filters to find the paths that interest you most (eg “begins with” or “ends with”). Hopefully before R&A goes away, Adobe will have some way to truly replicate that Path Finder functionality, but in the meantime, this at lease gives you some options. If you have a specific use case you want to achieve and don’t know how, leave a comment here or find me on #measure slack or twitter, and I’d love to help you figure it out.
If nothing else, now more of the world will know about how handy TEXTJOIN is ;).
This is a bit anticlimactic of a post, for my triumphant return after a long while of not blogging, but this question keeps coming up so I figured I’d document it publicly so I can reference it when needed. I find many of my posts that are for my own benefit, to use as a reference, tend to be the most viewed posts, so here’s Jenn’s notes to herself about converting Doubleclick tags to gtag:
Quick Reference
If you’re generally familiar with gtag and the old Doubleclick/Floodlight/Search Ads 360 tags, and just want a quick reminder of the order of things, here is the format of the send_to variable, inspired by Google’s documentation:
‘send_to’ : ‘DC-[floodlightConfigID (src)]/[activityGroupTagString (type)]/[activityTagString (cat)]+[countingMethod-either conversion or purchase]
That’s src, type, and cat pulled from these spots:
If that doesn’t make a lot of sense to you, you need more examples, or you just want to understand it better, read on.
Walkthrough
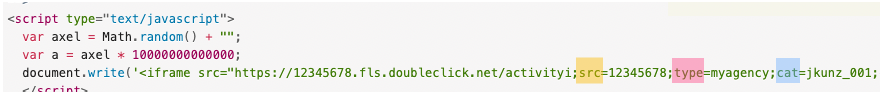
Doubleclick’s standard tag used to look something like this (sometimes using an img instead of an iframe, but the same general idea either way):
<!--
Start of Floodlight Tag: Please do not remove
Activity name of this tag: Jenn-Kunz-Example-Tag
URL of the webpage where the tag is expected to be placed: https://www.digitaldatatactics.com/
This tag must be placed between the <body> and </body> tags, as close as possible to the opening tag.
Creation Date: 08/18/2021
-->
<script type="text/javascript">
  var axel = Math.random() + "";
  var a = axel * 10000000000000;
  document.write('<iframe src="https://12345678.fls.doubleclick.net/activityi;src=12345678;type=myagency;cat=jkunz_001;dc_lat=;dc_rdid=;tag_for_child_directed_treatment=;tfua=;npa=;gdpr=${GDPR};gdpr_consent=${GDPR_CONSENT_755};ord=' + a + '?" width="1" height="1" frameborder="0" style="display:none"></iframe>');
</script>
<noscript>
  <iframe src="https://12345678.fls.doubleclick.net/activityi;src=12345678;type=myagency;cat=jkunz_001;dc_lat=;dc_rdid=;tag_for_child_directed_treatment=;tfua=;npa=;gdpr=${GDPR};gdpr_consent=${GDPR_CONSENT_755};ord=1?" width="1" height="1" frameborder="0" style="display:none"></iframe>
</noscript>
<!-- End of Floodlight Tag: Please do not remove -->
Some agencies/deployments still use this format. You may get a request from an agency or marketer to deploy a tag documented this way. But if you already use gtag on your site, or you just want to modernize and take advantage of gtag, you can convert these old iframe tags into gtag by just mapping a few values.
Before you get started, you need to note a few things from your original tag:
1. The “src”, also known as your account ID. 2. The “type”, also known as a “Activity Group Tag String” 3. The “category”, also known as the “Activity Tag String”
Keep track of these, we’ll use them in a moment. (If you also have custom dimensions or revenue and such, hang on, we’ll get to those in a bit.)
Step 1. Global Site Tag code
First, make sure you have gtag code on your site. No matter how many tags use it, you only need to reference it once.
Note, I’m only walking through the code; if you’re in Launch, using a tool like Acronym’s Google Site Tag extension (which is great, in my opinion), hopefully this post combined with their documentation will be enough to get you what you need to know.
<!--
Start of global snippet: Please do not remove
Place this snippet between the <head> and </head> tags on every page of your site.
-->
<!-- Global site tag (gtag.js) - Google Marketing Platform -->
<script async src="https://www.googletagmanager.com/gtag/js?id=DC-12345678"></script>
<script>
  window.dataLayer = window.dataLayer || [];
  function gtag(){dataLayer.push(arguments);}
  gtag('js', new Date());

  gtag('config', 'DC-12345678');
</script>
<!-- End of global snippet: Please do not remove -->
The part that matters, that establishes which gtag accounts you want to set up, is in the config:
This is where you’d put #1- Your Account ID. Add a “DC-” to the front of it (DC for Doubleclick, as opposed to AW for AdWords…), and you have your config ID.
Step 2. Send an event
With that, you have the gtag library on your page, and you’ve configured it. But this merely “primes” your tracking…. it sets it up, but does not actually send the information you want. For that, you need to convert your original iframey tag into a gtag event. A traditional gtag event looks like this:
<!--
Event snippet for Jenn-Kunz-Example-Tag-Home-Page on https://www.digitaldatatactics.com: Please do not remove.
Place this snippet on pages with events that you’re tracking.
Creation date: 08/19/2021
-->
<script>
  gtag('event', 'conversion', {
    'allow_custom_scripts': true,
    'send_to': 'DC-12345678/myagency/jkunz_001+standard'
  });
</script>
<noscript>
<img src=""https://ad.doubleclick.net/ddm/activity/src=12345678;type=myagency;cat=jkunz_001;dc_lat=;dc_rdid=;tag_for_child_directed_treatment=;tfua=;npa=;gdpr=${GDPR};gdpr_consent=${GDPR_CONSENT_755};ord=1?"" width=""1"" height=""1"" alt=""""/>
</noscript>
<!-- End of event snippet: Please do not remove -->
But the part we need (and the only part that actually sends info to google) is just this:
So this in your original iFrame/pixel Doubleclick tag:
Becomes this for gtag:
There are two other things to pay attention to in that gtag event, and they don’t map directly to something in your original tag:
(Note, the “allow_custom_scripts” will always be true, so you don’t need to worry about it.)
The event type (“conversion”) and the counting method (“+standard”) will reflect whether or not your tag is for a purchase or not. For the Counting Method, Google says:
Standard counts every conversion by every user. This is the counting method for action activities generated in Search Ads 360.
Transactions counts the number of transactions that take place, and the cost of each transaction. For example, if a user visits your website and buys five books for a total of €100, one conversion is recorded with that monetary value. This is the counting method for transaction activities generated in Search Ads 360.
Unique counts the first conversion for each unique user during each 24-hour day, from midnight to midnight, Eastern Time (US).
In other words, most cases will be “conversion”/”+standard”, unless you’re tracking a purchase, in which case it will be “purchase”/”+transaction”. If your original tag has cost and qty in it, then it’s a purchase, otherwise, it’s likely just a conversion and you can use “+standard” as your counting method. On a rare occasion, you may be asked to use “+unique” so the conversion only counts once per day. I hear there may be other counting methods, but I don’t have examples of them.
If your tag is a conversion and you’re not sending custom variables, then the allow_custom_scripts and the send_to is all you need- you’re done! If it is a transaction and/or you have custom variables, read on.
Transactions
If your original iframey tag is intended for a purchase confirmation page, it probably includes a “qty”, “cost” and “ord”, with the intent for you to dynamically fill these in based on the user’s transaction:
If so, then your gtag will need a few more things, like value and transaction_id (and make sure your event type is “purchase” instead of “conversion”) :
The mapping for these is probably fairly obvious. What was “cost” goes into “value”; what was “ord” goes into “transaction_id”:
Quantity seems to have fallen by the wayside; the old iframey tags asked for it but I’ve never seen it in a gtag purchase tag.
Maybe it could go without saying, but to be clear, the expectation is that you’d dynamically fill in those values in square brackets. So if you’re in Launch, it might look like this:
Again, the expectation is that you would replace anything in square brackets with dynamic values that reflect the user’s experience. I often leave the description they provided in comments, just for reference and to make sure I’m putting stuff in the right places.
You may be wondering about some of the other bits of code in the original iframey tag:
The “axel” stuff was a cache buster, to prevent the browser from loading the iframe or img once, then pull it from cache for later views. The cache buster would generate a new random number on every page load, so to the browser it looked like a new file rather than the file it has in its cache. The good news is, gtag handles cache busting, as well as all that other stuff for you; it’s not needed any longer. Gtag also handles GDPR differently so you don’t need to carry those parameters over.
NoScript
A quick word about the noscript tags:
These are a remnant of an older internet, where mobile devices didn’t run JavaScript, and tag management systems didn’t exist. It says “if the user doesn’t run JavaScript, then run this HTML instead”, usually followed by a hard-coded pixel.
Frankly, it’s comical that anyone includes these anywhere anymore:
These days, the only devices not running JavaScript are bots. Unless you WANT inflated numbers (maybe some agencies/vendors do), you don’t want bot traffic.
Sometimes vendors/agencies will ask for dynamic values within the noscript tag: Which is just silly- without JavaScript, the only way to dynamically set those values would be to have them set serverside. Which I’ve never seen anyone do.
Finally… if you’re deploying it through a Tag Management System, and the user isn’t running JavaScript, the TMS won’t run at all, meaning the rule won’t fire, meaning the noscript tag will never get a chance to be written.
In short, delete noscript tags and their contents. Some agencies may not know these not-exactly-rocket-science nuances of the internet, and may whine at you about not including the noscript tag because they have a very specific checklist to follow. Include it if you must to appease the whiners, but… know that if it’s within a TMS, the contents of that noscript tag will never see the light of day.
How to send to multiple accounts
This isn’t tied directly to converting from old tags, but for reference…. if you want to send a gtag event to multiple accounts, instead of duplicating the tag, you can add a config in your global code:
<script async src="https://www.googletagmanager.com/gtag/js?id=DC-12345678"></script>
<script>
  window.dataLayer = window.dataLayer || [];
  function gtag(){dataLayer.push(arguments);}
  gtag('js', new Date());

  gtag('config', 'DC-12345678');
  gtag('config', 'DC-87654321');
</script>
Then in your event code, turn the “send_to” into an array:
You may ask “If I only need to have the gtag library script once, and I have multiple gtags, what do I do about this id on the global script src?”
To be honest, that bit matters very little. I usually just delete it, or leave it with whatever ID was on the first gtag I added (if someone knows what purpose that ID serves and wants to tell me I shouldn’t be deleting it, please chime in). The “configs” are the important part.
Conclusion
It’s not exactly cutting-edge content, nor relaxing bedside reading, but I hope this comes in handy for those for those struggling to find answers in existing documentation. Cheers!
Disclaimer: I’m not a Doubleclick expert, but I have deployed many many Doubleclick tags- I daresay hundreds of them. If any of the above isn’t “gospel truth”, it’s “truth that worked for me”, but I’d love to hear if any of my reasoning/theories are incorrect or incomplete.
Almost every organization that uses Digital Analytics has some combination of the following documents:
Business Requirements Document
Solution Design Reference/Variable Map
Technical Specifications
Validation Specifications/QA Requirements
All of the consulting agencies use them and may even have their own special, unique versions of them. They’re often heavily branded and may be closely guarded. And it can be very difficult to find a template or example as a starting point.
In my 11 years as a consultant who focuses on Digital Analytics implementation, I’ve been through MANY documentation templates. I’ve used the (sometimes vigorously enforced) templates provided by whoever was my current employing agency; I’ve used client’s existing docs; I’ve created and recreated my own templates dozens of times. I’ve used Word documents, Google Sheets, txt/js documents, Confluence/Wiki pages, and (much to my chagrin) Powerpoint presentations (there’s nothing wrong with Powerpoint for presentations, but it really isn’t a technical documentation tool). I’ve in turn shared out templates and examples both within agencies and more broadly in the industry, and I’ve now decided it’s time to stop hoarding documentation templates and examples, and share them publicly in a git repo, starting with the most foundational: the Variable Map (sometimes called a Solution Design Reference, or SDR).
The Variable Map
You may or may not have a tech spec or a business requirements document, but I bet you have a document somewhere that lays out the mapping of your custom dimensions and metrics. Since Adobe Analytics has up to 250 custom eVars, 75 custom props, and up to 1000 custom events, it’s practically essential to have a variable map. In fact, the need for a quick reference is why I created the PocketSDR app a few years ago (shameless plug) so you could use your phone to check what a variable was used for or what its settings are. But when planning/maintaining an implementation, you need a global view of all your variables. This isn’t a new idea: Adobe’s documentation discusses it at a higher level, Chetan Gaikwad covered it on his blog more recently, Jason Call blogged about this back in 2016, Analytics Demystified walked through it in 2015, and even back in 2014, Numeric Analytics discussed the importance of an SDR. Yet if you want a template, example, or starting point, you still generally have to ask colleagues and friends to pass you one under the table, use one from a previous role/org, or you just start from scratch. This is why 33 Sticks is making a generic SDR publicly available on our git repo.
The cats out of the bag
There are various reasons folks (including me) haven’t done this in the past. For practitioners, there is (understandably) a hesitance to share what you are doing- you might not want your brand to be associated with how good/not good your documentation is, and/or you may not want to give your competitors any “help” (more on that in an upcoming podcast). For agencies, there may be a desire to not show “the man behind the curtain”, or they may believe (or at least want their clients to believe) that their documentation is special and unique.
So why am I sharing it?
Because I don’t think the format of my variable map is actually all that special- a variable map is a variable map (but that doesn’t mean we should all have to start from scratch every time). This isn’t intended to be the end-all-be-all of SDRs, but rather, as a starting point or an example for comparison. Any aspect of it might be boring/obvious to you, overkill, or just not useful, but my hope is that there is at least a part of it that will be helpful.
Because while I DO think I have some tricks that make my SDRs easier to use, I recognize that most of those tricks are things I only know or do because someone in the industry has shared their knowledge with me, or a client let me experiment a bit to find what worked best.
Because 33 Sticks doesn’t bill by the hour and I have no incentive to hoard “easy”/low-level tasks from my clients. If a client comes to me and says “I used your blog post to get started on an SDR without you”, I can say, “Great! That leaves us more time to get into more strategic work!”
Because where I can REALLY offer value as a consultant isn’t in the formatting/data entry part of creating an SDR, but rather, in the thought we put into designing/documenting solutions, and in how we help clients focus on goals and getting long-term value out of data so they don’t get stuck in “maintenance mode.”
And finally, because I’m hoping to hear back from folks and learn from them about what they’re doing the same or differently. We all benefit from opening up about our techniques.
Enough with the pedantry, let’s get back to discussing how to create a good SDR.
SDR Best Practices
It’s vitally important you keep your variable map in a centrally-accessible location. If I update a copy of the SDR on my hard drive, that doesn’t benefit anyone but me, and by the time I merge it back into the “global” one, we may already have conflicts.
It should go without saying, but keeping it updated is also a good idea. I actually view most types of Digital Analytics documentation as fitting into one of two categories: primarily useful at the beginning of an implementation, OR an ongoing, living document. Something like a Business Requirements Document COULD be a living document, but let’s be honest: its primary value is in designing the solution, and it can have a high level of effort to keep it comprehensively up-to-date. Technical specifications for the data layer are usually a one-time deal: after it is implemented, it goes into an archive somewhere. But the simple variable map… THAT absolutely should be kept current and frequently referenced.
Tools for Creation/Tracking
If you’re already using Adobe Analytics, then you probably need to get an accurate and current list of your variables and their settings. Even if you have an SDR, you should check if it matches what’s set up in your Analytics tool. You could always export your settings from within the Admin Console, but I’ve found the format makes the output very difficult to use. I’d recommend going with one of the many other great industry tools (all of which are free):
Adobe Consulting has a Health Dashboard that uses the Admin and Reporting APIs to not only pull down your settings, but show you the top values for each report and highlights recent changes in data.
If you use the Adobe Experience Cloud Debugger chrome extension and are logged in to the Experience Cloud, it will show you the friendly names of your variables directly in your beacon.
These tools are great for getting your existing settings, but they don’t leave a lot of room for planning and documenting the full implementation aspects of your solution, so usually I use these as a source to copy my existing settings into my SDR.
What should an SDR contain?
On our git repo, you’ll see an Excel sheet that has a generic example Variable Map. Even if you have an SDR that you like already, take a look this example one- there may be some items you might get use of (plus this post will be much more interesting if you can see the columns I’m talking about).
Pretty much ALL Variable Maps have the following columns (and mine is no different):
Variable/Report Name (eg, “Internal Search Terms”)
Variable/Report Number (eg, “eVar1”)
Description
Example Value
Variable Settings
But over the years I’ve found a few other columns can really make the variable map much more use-able and useful (and again, this all may make more sense if you download our SDR to have an example):
A “Sorting Order” or Key
If, like me, you love using tables, sorting, and filtering in Excel, you may discover that Excel doesn’t know how to sort eVars, props and events: because it isn’t fully a number or string, it thinks that the proper order is “eVar1, eVar10, eVar2, eVar20”. So if you’ve sorted for some small task and want to get back to a sensible order, you pretty much have to do things manually. For this reason, I have a simple column that has nothing other than numbers indicating my ideal/proper/default order for my table.
Param
This is for those who live their lives in analytics beacons rather than reports, like a QA team. It’s nice to know that s.campaign is the variable, and it is named “Tracking Code” in the reports, but it’s not exactly obvious that if you’re looking in a beacon, the value for s.campaign shows in the “v0” parameter.
Variable Type
Again, I love me some Excel filtering, and I like being able to say “show me just my eVars” or “show the out of the box events”. It can also be handy for those not used to Adobe lingo (“what the heck is an eVar?”). So I have a column with something like the following possible values:
eVar- custom conversion dimension
event- custom metric (eg “event1”)
event- predefined metric (eg “scAdd”, “purchase”)
listVar- custom conversion dimension list (eg, “s.list1”)
For things like this, where I have specific values I’ll be using repeatedly, I’ll keep an extra tab in the workbook titled “worksheet config”. Then I can use Excel’s “data validation” to pull a drop-down list from that tab.
Category
This is my personal favorite- I use it every day. It’s a way to sort/group variables and metrics that are related to each other- eg, if you are using eVar1, eVar2, prop1, event1, and event2 all in some way to track internal search, it’s nice to be able to filter by this column and get something like this:
The categories themselves are completely arbitrary and don’t need to map to anything outside of the document (though you might choose to use them in your Tech Spec or even in workspaces). Here’s a standard list I might use:
Content Identification
Internal Search
Products
Checkout
Visitor Segmentation
Traffic Sources
Authentication
Validation/Troubleshooting
Again, I could create/maintain this list in a single place on my “worksheet config” tab, then use “Data Validation” to turn it into a drop-down list in my Variable Map.
Status
This basically answers the question “is this variable currently expected to be working in production?” I usually have three possible values:
Implemented
Broken (or some euphemism for broken, like “needs work”)
In progress
Data Quality Notes
This is for, well, notes on Data Quality. Such as “didn’t track for month of March” or “has odd values coming from PDP”.
Last Validated
This is to keep track of how recently someone checked on the health of this variable/metric. The hope is this will help prevent variables sitting around, unused, with bad data, for months or even years. I even add conditional formatting so if it has been more than 90 days, it turns red.
Scope
Where would I expect to see this variable/metric? Is it set globally? Or maybe it happens on all cart adds?
Description
I’m certainly not unique in having this column, and I’m probably not unique in how many SDRs I’ve seen where this column has not been kept up-to-date. I’d like to stress the importance of this column, though- you may think the purpose of a variable is obvious, but almost every company I’ve worked with has at least one item on their variable map where no current member of the analytics team has any idea what the original goal was.
Ideally, the contents of this column would align with the “Description” setting within the Admin Console for each variable, so that folks viewing the reports can understand how to use the data.
We ARE all setting and using those descriptions, right? RIGHT?
Logic/Formatting and Example Value
Your Variable Map needs to have a place to detail the type of values you’d expect in this report. This:
helps folks looking at the document to understand what each variable does (especially if you don’t have stellar descriptions)
lets developers/implementers know what sort of data to send in
provides a place to make sure values are consistent. For instance, if I have a variable for “add to cart location”, there’s no inherent reason why the value “product details page” would be more correct than “product view”… but I still only want to see ONE of those values in my report. If folks can look in my variable map and see that “product details page” is the value already in use, they won’t go and invent a new value for the same thing).
I often find it a good exercise to run the Adobe Consulting Health Dashboard and grab the top few values from each variable to fill out this column.
Source Type
What method are we using to get the value for the data layer? I usually use Excel Data Validation to create this list:
query param
data layer
rule-based/trigger-based (like for most events, which are usually manually entered into a TMS rule based on certain conditions)
analytics library (aka, plugins)
duplicate of another variable
Dimension Source or Metric Trigger
This contains the details that complement the “source type” column: If it comes from query parameters, WHICH query parameter is it? If it comes from the data layer, what data layer object is it? If it’s a metric, what in the data layer determines when to fire it (for instance, a prodView event doesn’t map directly to a data layer object, but it does RELY on the data layer: we set it whenever the pageType data layer object is set to “product details page”.)
Variable Settings
This is something many SDRs have but can be a pain to keep consistent, because every variable type has different settings options:
As you can see, you’d have to account for a lot of possible settings and combinations- I’ve seen some SDRs with 30 columns dedicated just to variable settings. I tend to simplify and just have one column where I only call out any setting that differs from the default, such as “Expires after 2 weeks” or “merchandising: conversion syntax, binds on internal search event, product view, and cart add.”
Classifications
This should list any classifications set up on this variable. This is a good one to keep updated, though I find many folks don’t.
GDPR Considerations
Don’t forget about government privacy regulations! Use this to flag items that will need to be accounted for in your privacy policies and procedures. Sometimes merely having the column can serve as a good reminder that privacy is something we need to consider when designing our solution.
TMS Rule and TMS Element
I find these very helpful in designing a solution, but I’ll admit, they often fall by the wayside after an implementation is launched- and I don’t even see that as a bad thing. Once configured, your TMS implementation should speak for itself. (This will be even more true when Adobe releases enhanced search functionality in Launch.)
Other tabs
Aside from the variable map, I try to always have a tab/sheet for a Change Log. If nothing else, this can help with version control when someone had a local copy of the SDR that got off sync from the “official” one. It also lets you know who to contact if you have questions about a certain change that was made. I also use this to flag which changes have been accounted for in the Report suite Settings (eg, I may have set aside eVar2 for “internal search terms”, but did I actually turn it on in the tool?)
If you have many Report Suites, it may be helpful to have a tab that lists them all- their friendly name, their report suite ID, any relevant URLs/Domains, and perhaps the business owner of that Report Suite.
Also, if you have multiple report suites, you may want to add columns to the variable map or have a whole separate tab that compares variables across suites (the Report Suite exporter and the Observepoint SDR Builder both have this built in).
What works for you?
As I said, I don’t think my template is going to be the ultimate, universal SDR. I’d love to know what has worked for other people- did I miss anything? Is there anything I’m doing that I should do differently? Do you have a template you’d like to share? I’d love to hear from you!